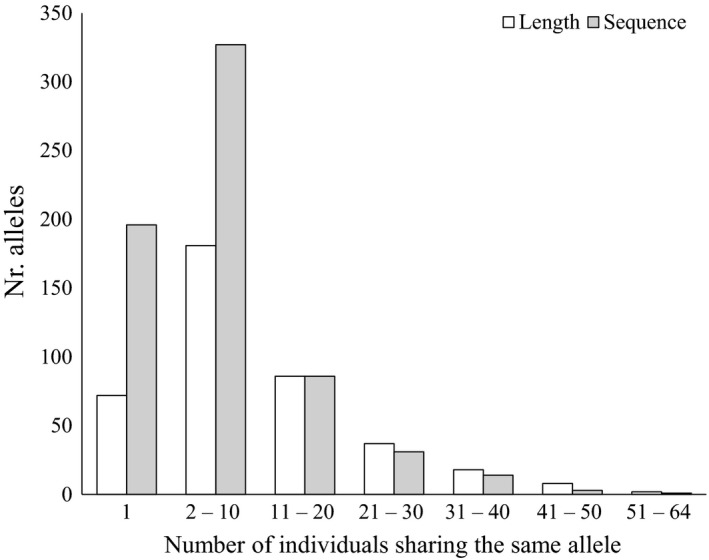
Figure 3.

Number of alleles shared among individuals shown as the number of alleles (y‐axis) in dependence to the number individuals that share one allele (x‐axis). White and gray bars represent alleles called using sequence length information, respectively. The comparison includes the final 41 markers for all 82 individuals
