
Figure 5.
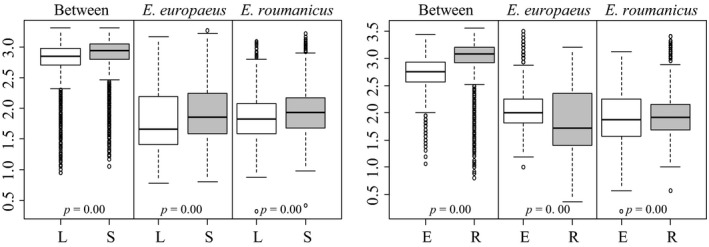
Boxplots describing pairwise distance between samples. Left panel using different allele calling approaches: sequence length (L) and sequence information (S). Right panel using different markers sets: E. europaeus‐specific primers (E) and E. roumanicus‐specific primers (R). Distance between the two species (Between) and within each species are shown. p‐Values correspond to t tests comparing differences in averages between genotyping methods and markers sets