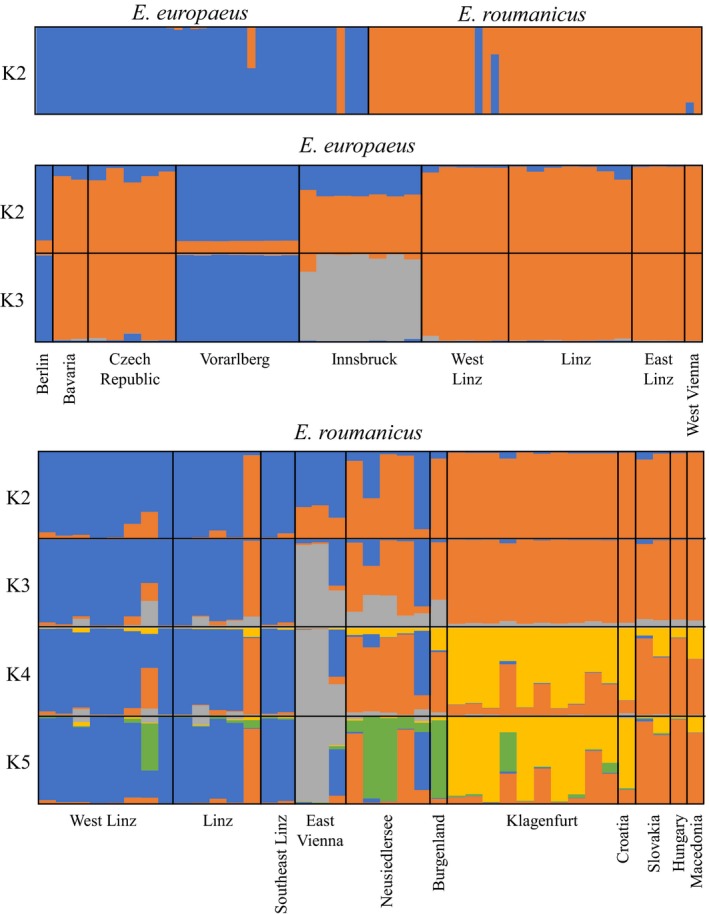
Figure 7.

Structure analysis for all three datasets (All samples, only E. europaeus, only E. roumanicus) considering all markers and alleles called based on sequence information. Only results from K = 2 until the optimum are shown

Structure analysis for all three datasets (All samples, only E. europaeus, only E. roumanicus) considering all markers and alleles called based on sequence information. Only results from K = 2 until the optimum are shown