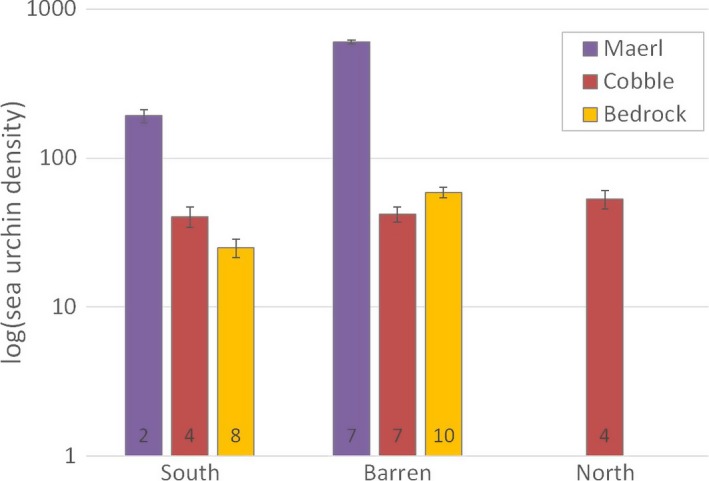
Figure 7.

Average densities (predicted abundances per m2 ±2SE from GAM) of sea urchins (Strongylocentrotus droebachiensis) on three different substrate types (maerl beds, cobblestones, and bedrock) within the southern and northern recovery zones, and the barren zone (see map in Figure 3). The y‐axis is log‐transformed for illustrative purposes due to high sea urchin densities on maerl beds, particularly in the barren zone. The number of stations is shown at the column base
