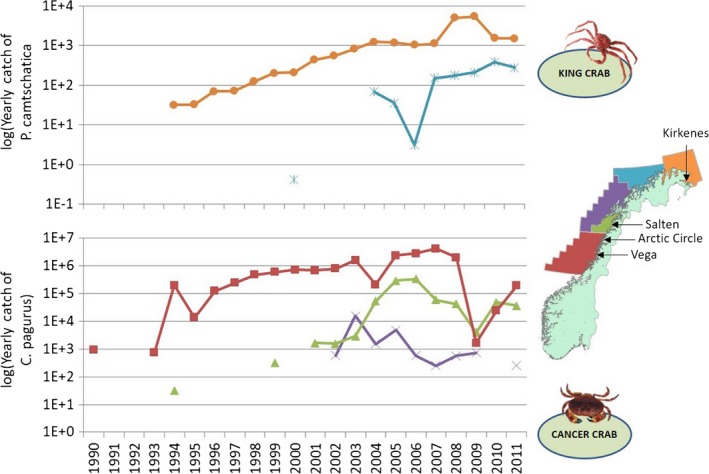
Figure 8.

Landings of red king crabs (Paralithodes camtschaticus, upper panel) and edible crab (Cancer pagurus, lower panel) within different fisheries zones from the 1990s to 2011. The color codes of the curves match the fishery zones. Data are from the Norwegian Directorate of Fisheries. Y‐axis is log‐transformed to show temporal variation also at low catch levels
