Figure 2.

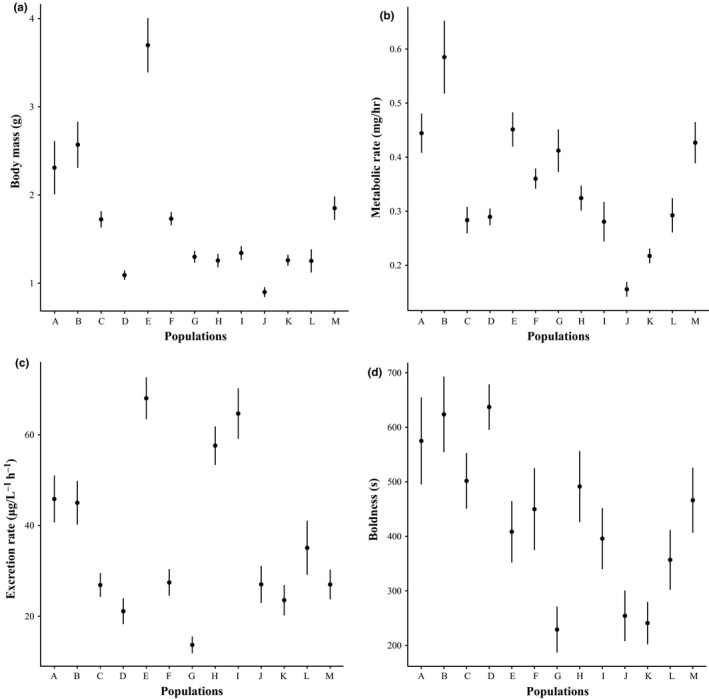
Mean trait values for body mass (a), metabolic rate (b), excretion rate (c), and boldness (d) in function of the population origin of fish. Error bars represent ±1SE

Mean trait values for body mass (a), metabolic rate (b), excretion rate (c), and boldness (d) in function of the population origin of fish. Error bars represent ±1SE