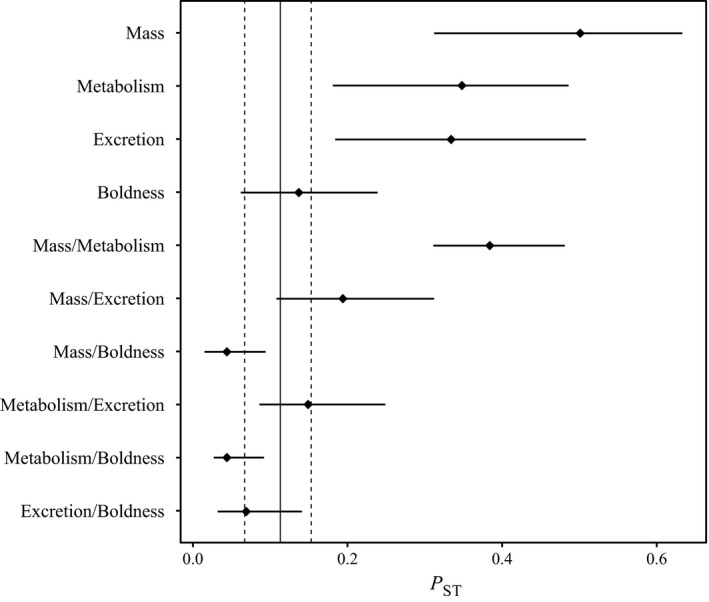
Figure 4.

Estimates of P ST for each trait (body mass, metabolic rate, excretion rate, and boldness) and for each covariation (body mass–metabolic rate, body mass–excretion rate, body mass–boldness, metabolic rate–excretion rate, metabolic rate–boldness, and excretion rate–boldness), and F ST (vertical straight line) on neutral microsatellite markers. Horizontal bars represent 95% confident interval of P ST , and vertical dotted line represents 95% confident interval of F ST that were calculated using cluster bootstrap procedure
