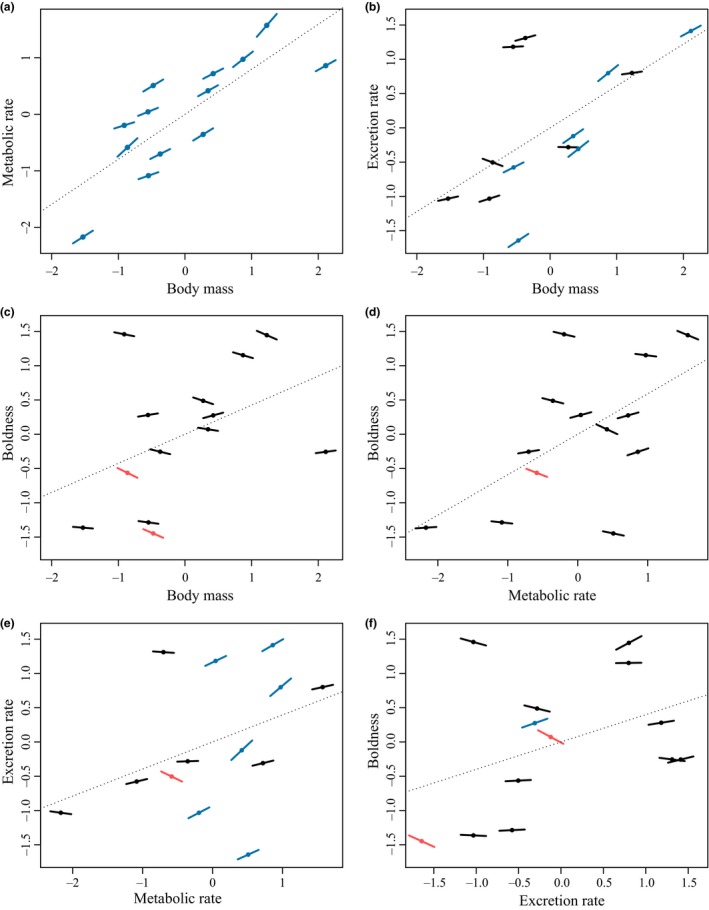
Figure 6.

Covariations between each pair of functional traits: (a) body mass–metabolic rate, (b) body mass–excretion rate, (c) body mass–boldness, (d) metabolic rate–excretion rate, (e) metabolic rate–boldness, and (f) excretion rate–boldness. Points represent the average trait value for each population, and lines on points represent the covariations (i.e., the slope) between traits within each population. Blue and red lines indicate significant (α = 0.05) positive and negative covariations, respectively. The dotted lines represent the relationship between traits across the thirteen populations
