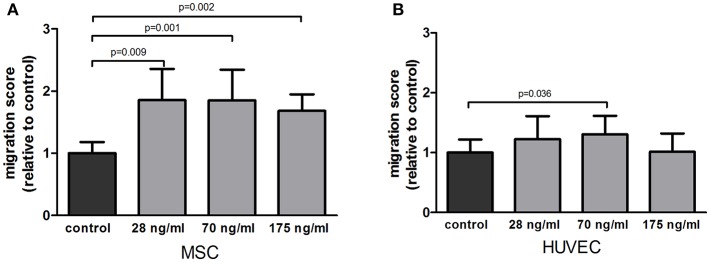
Figure 1.
Effect of follistatin upon MSC and HUVEC in a migration assay. (A) Average migration of MSCs exposed to several doses of follistatin (FST315) relative to the negative control (n = 4 donors in duplicate). (B) Average migration of HUVECs exposed to several doses of follistatin (FST315) relative to the negative control (n = 3 independent experiments in duplicate). The bars represent the mean ± SD.

