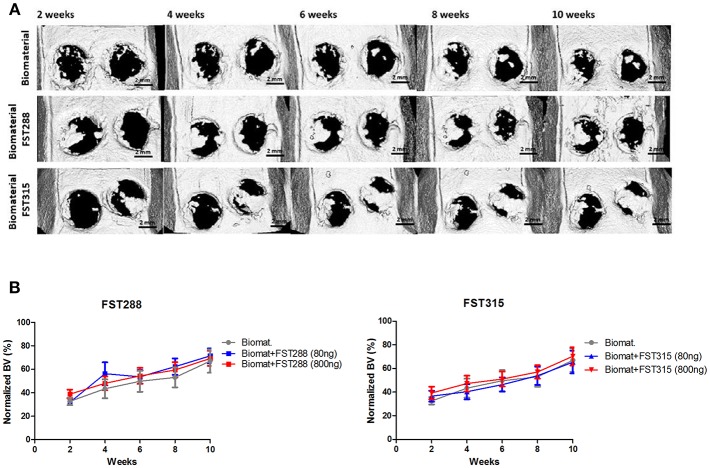
Figure 6.
In vivo μCT analysis of rat skulls implanted with FST288 and FST315 over time. (A) Representative in vivo μCT images of the skulls at 2, 4, 6, 8, and 10 weeks after implantation (scale bar: 2 mm) of either biomaterial alone or loaded with FST288 or FST315. In the representative μCT images of both FST variants the right defect was loaded with 800 ng of FST and the left defect was loaded with 80 ng of FST. (B) Graphical representations of in vivo μCT analysis. Bone volume was normalized to animals without surgical intervention. The effect of the formulation loaded with FST288 (left graph) and FST315 (right graph) was compared to the effect of the use of the biomaterial alone as control group.

