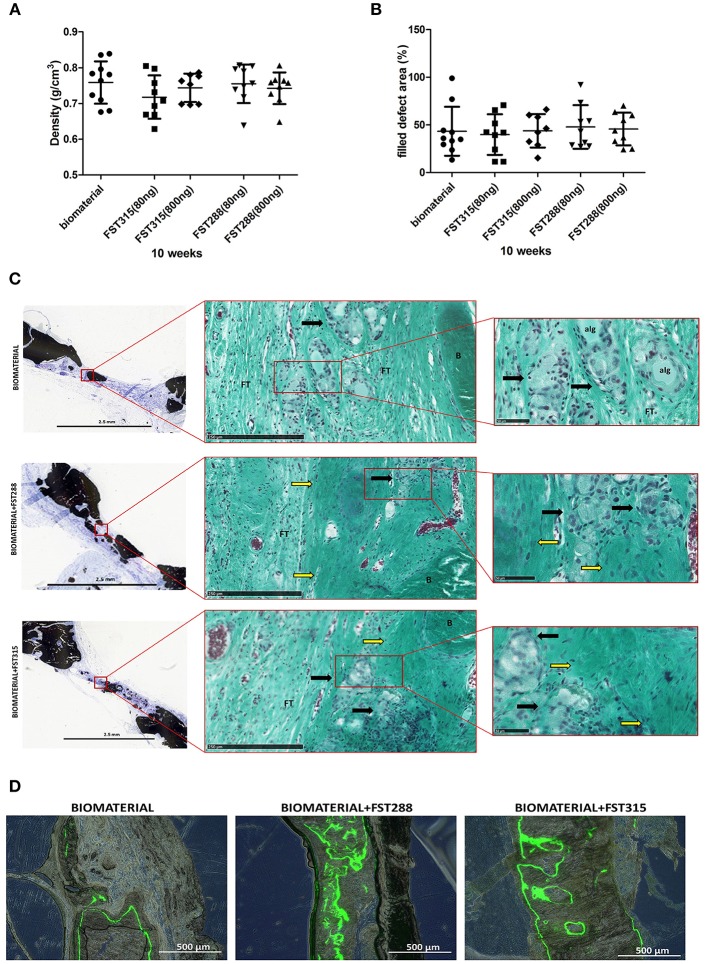
Figure 7.
Newly formed bone tissue at 10 weeks of healing. (A) Bone density observed by ex vivo μCT analysis in the different conditions after implant harvesting. (B) Percentage of defect filling by newly formed mineralized tissue analyzed by ex vivo μCT. Mean is indicated as the line plotted in the middle of the graphs ± SD. (C) Representative pictures of rat skulls implanted with the biomaterial w/o the addition of the FST variants at 10 weeks. Histological analysis includes von Kossa and Goldner's trichrome staining. Von Kossa staining was used to distinguish mineralized tissue (black) (scale bar: 2.5 mm), while Goldner's trichrome staining was used to determine bone histomorphometry. The square grid delimitates the selected magnified area for each image that is shown with Goldner's trichrome staining (scale bars are 250 μm and 50 μm, respectively), showing erythrocytes (red/purple), nuclei (blue/ gray), alginate remains (alg), formed bone (B), and fibrous tissue (FT). Immature ECM is indicated by yellow arrows and regions where the microspheres have been likely degraded are indicated by black arrows. (D) Representative fluorescence images of the central region of the explants showing calcein fluorochrome incorporation in the newly formed bone tissue at 10 weeks post-implantation (scale bar: 500 μm) with or without the addition of the FST variants. Fluorescence images are combined with bright-field images of the same area.

