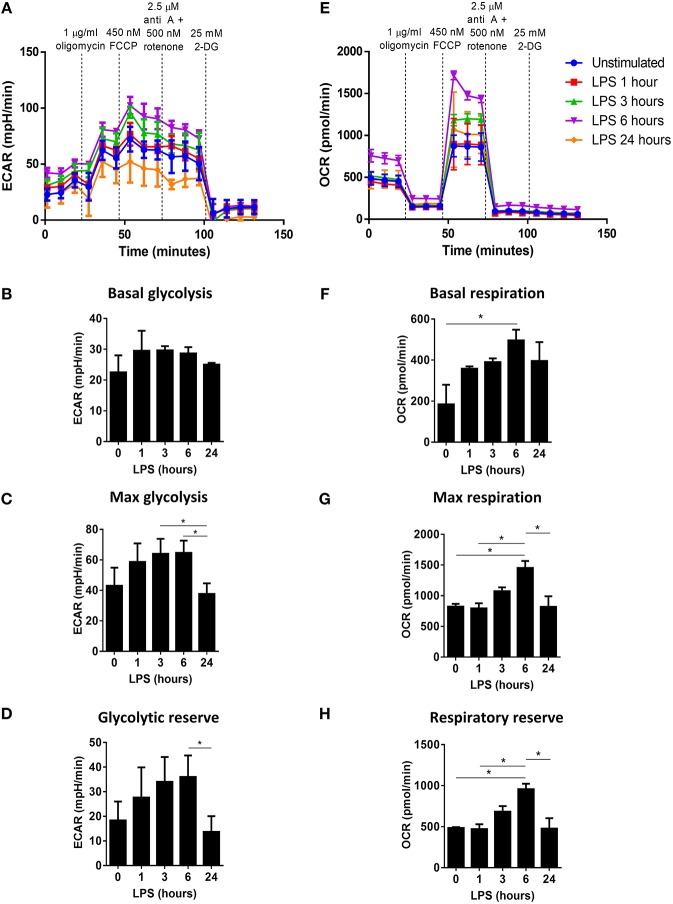
Figure 1.
Determination of the changes in glycolytic metabolism and oxidative phosphorylation over time in LPS-stimulated human DC. Primary human DC (n = 3) were stimulated with LPS (100 ng/ml) for 1, 3, 6, or 24 h prior to placement in a Seahorse XF24 analyser. The extracellular acidification rate (ECAR) and oxygen consumption rate (OCR) were measured before and after the addition of oligomycin (1 μg/ml), FCCP (450 nM), antimycin A (2.5 μM), and rotenone (500 nM), and 2-DG (25 mM). (A) ECAR measurements over time for each LPS stimulation time-point. Data depicts one representative experiment. Pooled data (n = 3) depicts the calculated mean (± SEM) (B) basal glycolytic rate, (C) max glycolytic rate, and (D) glycolytic reserve for each LPS stimulation time-point. (E) OCR measurements over time for each LPS stimulation time-point. Data depicts one representative experiment. Pooled data (n = 3) depicts the calculated mean (± SEM) (F) basal respiratory rate, (G) max respiratory rate, and (H) respiratory reserve for each LPS stimulation time-point. Statistical significance was determined by repeated measures one-way ANOVA with Tukey's multiple comparisons post hoc test to compare the means of all treatment groups (*p < 0.05).

