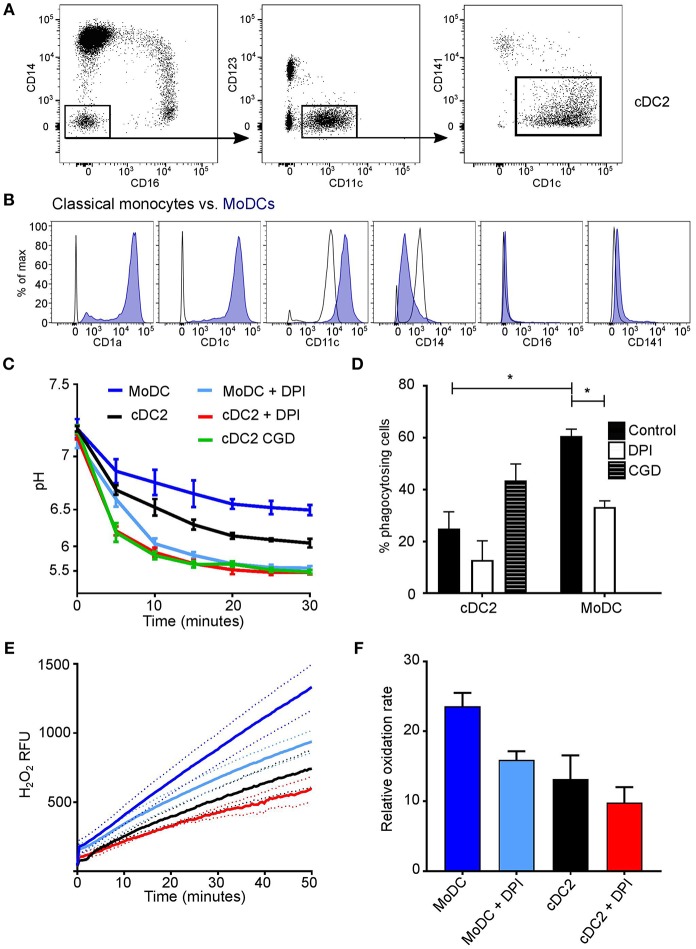
Figure 3.
Comparison of cDC2 and monocyte-derived DCs. (A) Gating strategy used to isolate cDC2 (CD1c+ DCs) using FACS; (B) in vitro derived-MoDC were phenotypically validated according to surface markers by comparison with their precursor classical monocytes (40, 41), a representative plot is shown based on three experiments; (C) Time course of changes in the pH in the phagosomes of MoDC and cDC2 mean ± SEM, from a healthy subject, with and without DPI (n = 3), and cDC2 from a CGD patient (n = 1); (D) quantitation of phagocytosis from (C), mean ± SEM. (E) NADPH oxidase activity in response to PMA stimulation in MoDs and cDC2 in the presence and absence of 5 μM DPI, mean (solid line) ± SEM (dashed line); (F) maximal rates of respiration from (E), mean ± SEM. Calculated p-values from one-way ANOVA with Bonferroni post-test analysis: *p < 0.05. For statistics of phagosomal pH (C) p < 0.05 for cDC2 vs. MoDC; p < 0.001 for cDC2 vs. DPI and for cDC2 vs. CGD; p < 0.001 for MoDC vs. DPI. For the respiratory burst (E): p < 0.01 for cDC2 vs. MoDC; no significance was found between cDC2 and cells with DPI, but p < 0.001 for MoDC vs. DPI.

