Figure 4.
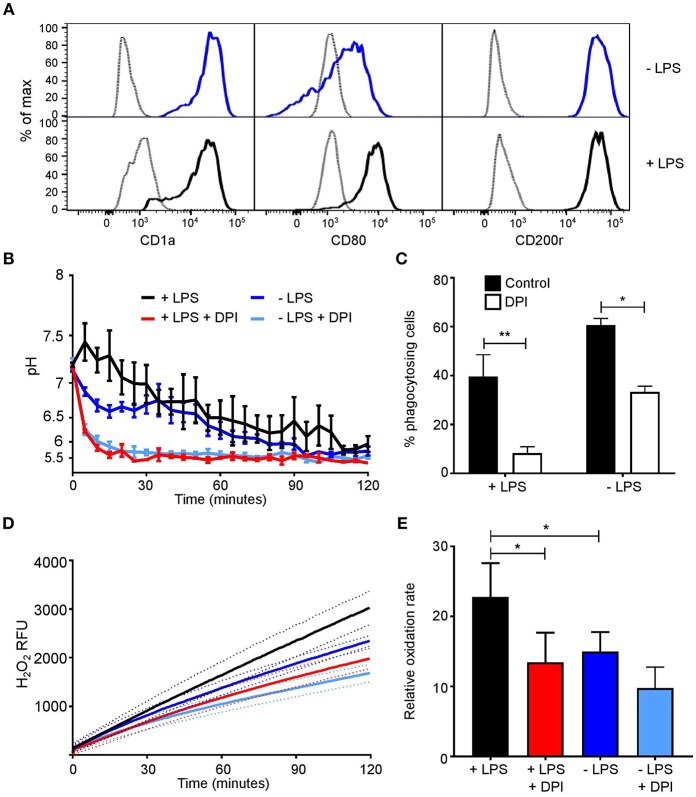
MoDC stimulated with LPS have more alkaline phagosomes and greater NADPH oxidase activity than untreated MoDC. (A) Flow cytometry phenotypic analysis of differentiation in untreated and LPS-treated MoDC. Gray, unstained controls; dark blue, untreated MoDC; black line, LPS + MoDC. (B) Time course of changes in phagosomal pH over 2 h in cells with and without 5 μM DPI, mean ± SEM. (C) Quantitation of phagocytosis from (B), mean ± SEM. (D) Time course of changes in NADPH oxidase activity in response to PMA stimulation, mean (solid line) ± SEM (dashed line); (E) relative oxidation rate calculated from the final 30 min of (D). Calculated p-values from one-way ANOVA with Bonferroni post-test analysis: **p < 0.01, *p < 0.05, n = 3. Statistics for (B) and (D) p < 0.0001 between control untreated and LPS-treated MoDC, and p < 0.0001 between control and DPI-treated cells.

