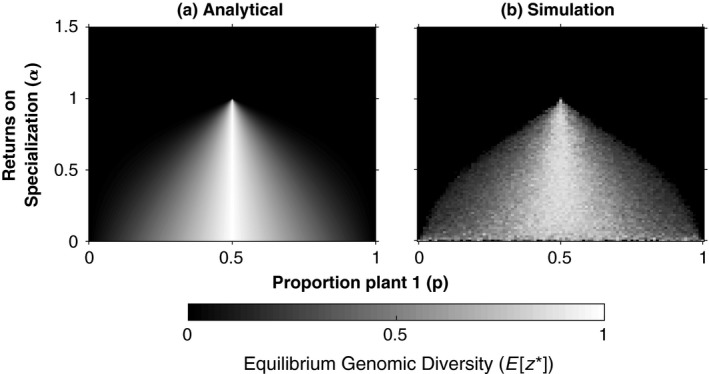
Figure 1.

Effect of environmental variability (p) and the curvature of specialization returns (α) on genomic diversity. Both parts show the level of genomic diversity at evolutionary equilibrium (E[z*]) in the absence of nuclear replicative differences. The y‐axis is the shape of the relationship between fitness and nucleus proportion (α), where α > 1 reflects accelerating returns to specialization and α < 1 reflects diminishing returns. The x‐axis is the proportion of plant species one (p), relative to plant species two (1‐p). Part (a) shows the analytically derived ESS of the Competing Individuals model, and part (b) shows the results of our individual‐based simulation (n = 2000, f = 0.005, d = 0.5, m = 0). The results of our ESS model and our simulation are quantitatively equivalent, showing that genomic diversity is stabilized, for diminishing returns to specialization (α → 0) and mixed environments (p → 0.5), in the absence of replicative differences between nuclei
