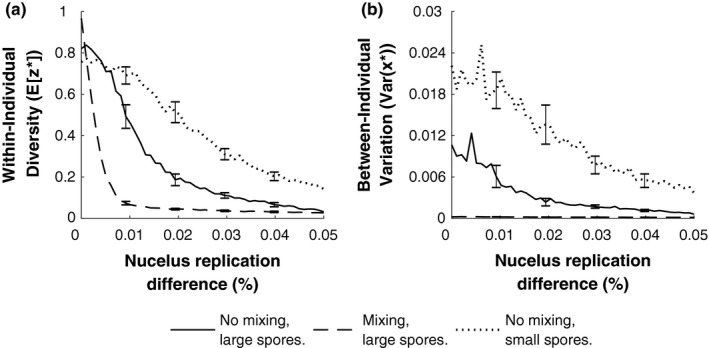
Figure 3.

Nuclear diversity within and between individuals. The within‐individual genomic diversity (a), and between‐individual variation in nuclear proportion (b), is plotted against the nuclear replicative advantage of type 1 nuclei (r1–r2/r2) (α = 0.8, p = 0.5, d = 0.5, r2 = 0.3, r1 is varied). The different lines represent different degrees of fusion (no fusion m = 0; fusion: m = 0.05) and different spore sizes (large: f = 0.005; small: f = 0.01). Fusion between lines (higher m) leads to an effectively complete loss of variation between individuals, which reduces the strength of between‐individual selection, and hence leads to a faster rate of loss of within‐individual genomic diversity. Smaller spores (higher f = 0.01) lead to an increased sporulation stochasticity, which increases between‐individual variation, resulting in a slower rate of loss of within‐individual genomic diversity. The plots represent the average results taken across 10 trials. Error bars, where plotted, show one standard deviation above and below the mean across these 10 trials
