
Figure 3.
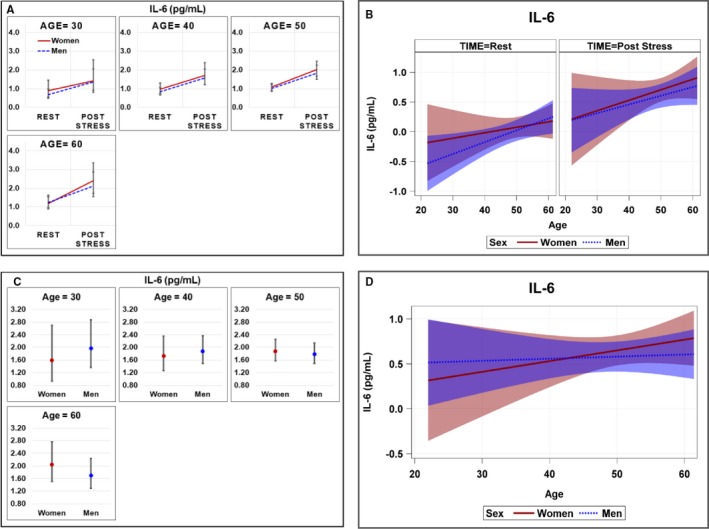
Geometric mean plasma concentrations and regression slopes with 95% confidence intervals of IL‐6 among women and men community controls. A, Geometric mean plasma concentrations at specified values of age (30, 40, 50, and 60 years) across sex and time; (B) regression slopes for age across sex and time; (C) inflammatory response; and (D) regression slopes for inflammatory response across age and sex. Repeated‐measures models were used to investigate age and sex differences across time testing for interaction of age (continuous) and sex. Inflammatory response was calculated as: (exp (loge(Post stress values)−loge(resting values)) within the repeated‐measures model. Natural log values modeled and presented as geometric means in (A) and (C). IL‐6 indicates interleukin‐6.