
Figure 1.
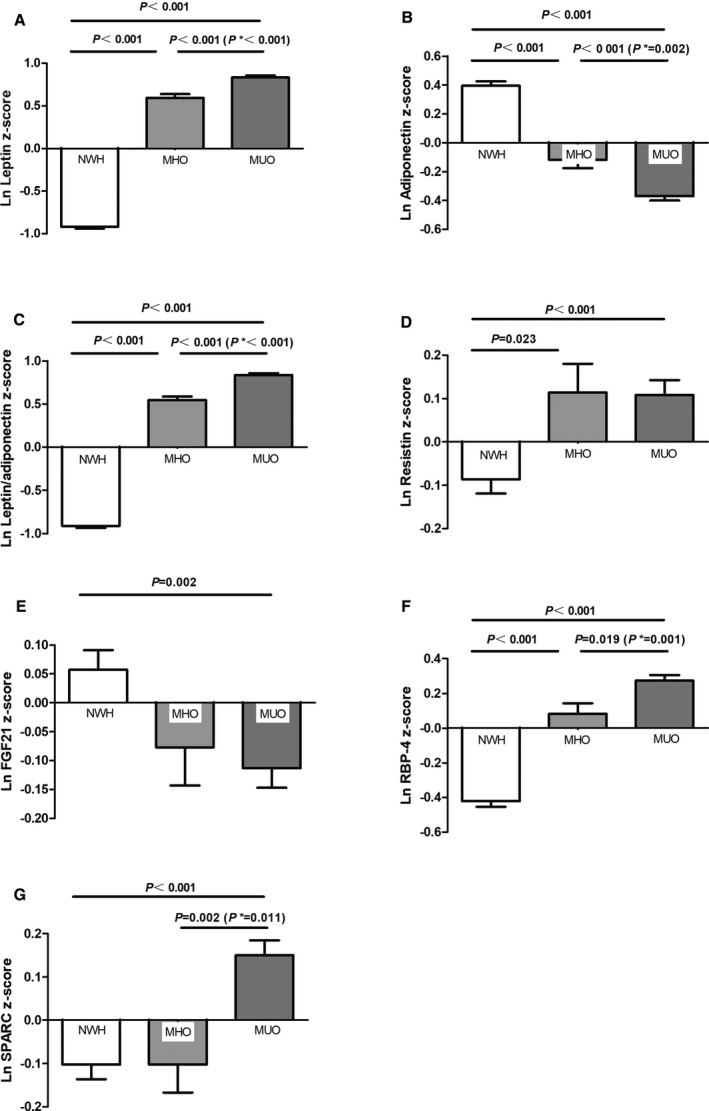
Comparison of adipokines levels across the 3 groups. Data were natural logarithmically (ln) transformed and expressed in standard deviations after adjusting for age, pubertal stages, residence, diet score, and physical activity. P* was further adjusted for body mass index based on the former models. Comparisons are shown across the 3 groups: ln leptin z score (A), ln adiponectin z score (B), ln leptin/adiponectin z score (C), ln resistin z score (D), ln FGF21 z score (E), ln RBP‐4 z score (F), and ln osteonectin z score (G). FGF21 indicates fibroblast growth factor 21; MHO, metabolically healthy obese; MUO, metabolically unhealthy obese; NWH, normal‐weight healthy; RBP‐4, retinol binding protein 4.