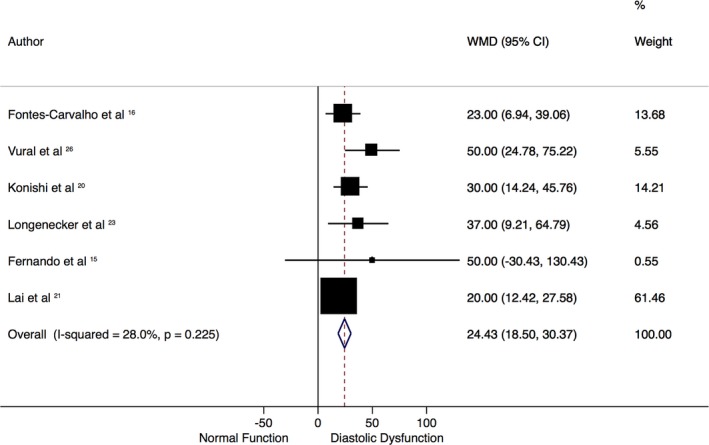
Figure 2.

Mean difference of epicardial adipose tissue (EAT) volume in patients with and without diastolic dysfunction. Forest plot demonstrates the weighted mean difference (WMD; in mL) of EAT in studies with and without diastolic dysfunction, according to a random‐effect model. Those with diastolic dysfunction have significantly greater EAT volumes. There is mild heterogeneity, as seen by the I2 statistic of 28%. CI indicates confidence interval.
