
Figure 3.
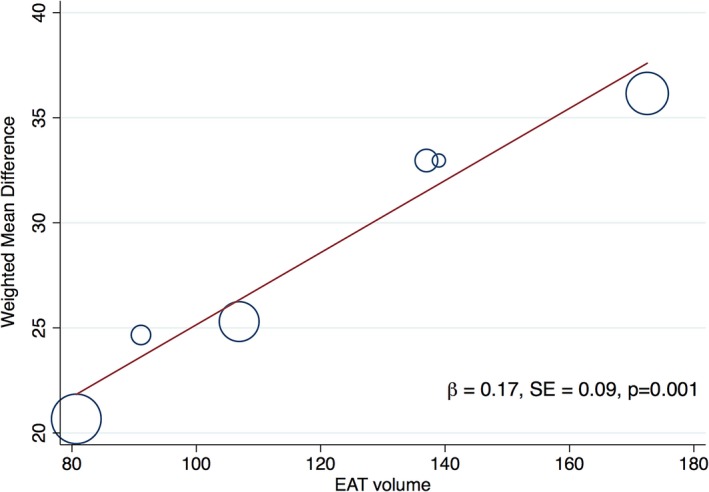
Meta‐regression of the effect of increasing epicardial adipose tissue (EAT) volume on the weighted mean difference (effect size) of EAT in patients with and without diastolic dysfunction. Meta‐regression bubble plot depicts increasing differences in mean EAT volume in patients with diastolic dysfunction as EAT increases. Circles represent the weight of each study. β coefficient is from meta‐regression with associated SEE; P value is from Monte‐Carlo testing (1000 simulations) and demonstrates a significant association (P=0.001).