Figure 4.

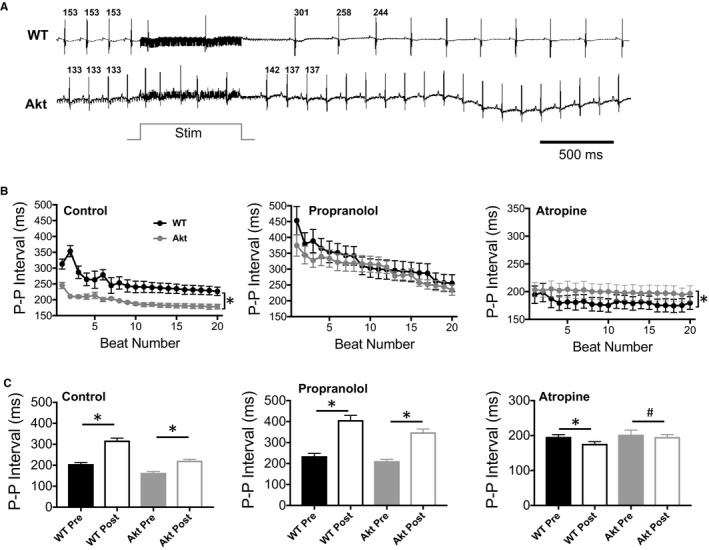
Modulation of the P‐P interval in the isolated Langendorff‐perfused wild‐type (WT) and Akita (Akt) mouse hearts by pulmonary vein ganglia (PVG) stimulation. A, ECG traces from WT and Akita hearts. The P‐P intervals of the 3 beats before and after stimulation were measured. Stim=700‐ms stimulation. B, P‐P intervals of the 20 beats following 700‐ms stimulation of the PVG in control (WT, n=7; Akt, n=7), propranolol (WT, n=8; Akt, n=8), or atropine (WT, n=5; Akt, n=5). *P<0.01, WT vs Akita hearts, Wilcoxon rank sum test. C, Average of 3 P‐P intervals preceding PVG stimulation (pre) and the average of the 3 P‐P intervals immediately following PVG stimulation of the experiments shown in panel B during control and treatment with propranolol or atropine. # P<0.05, *P<0.01, pre vs post, Wilcoxon signed rank test.
