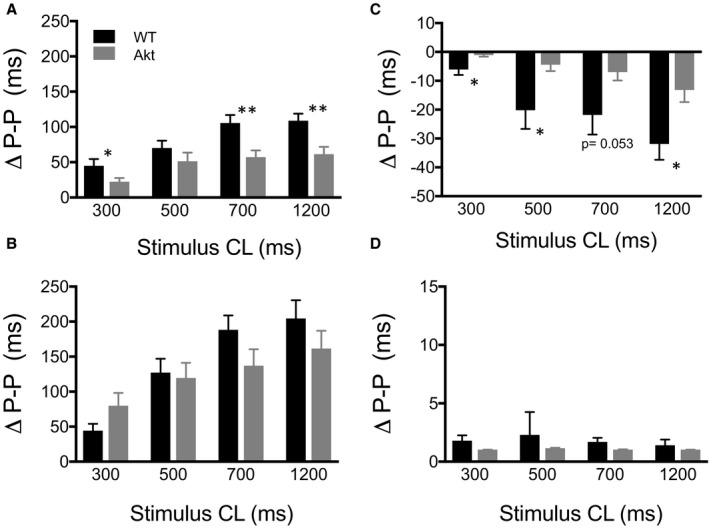
Figure 5.

Average change in P‐P interval of the first 3 beats after stimulation. Change in P‐P interval after stimulation with 300‐, 500‐, 700‐, and 1200‐ms stimulus trains in (A) control (wild type [WT], n=7; Akita [Akt], n=7), (B) propranolol (WT, n=8; Akt, n=8), (C) atropine (WT, n=5; Akt, n=5), and (D) propranolol plus atropine (WT, n=4; Akt, n=4). *P<0.05, **P<0.01, WT vs Akita hearts, t test. CL indicates cycle length.
