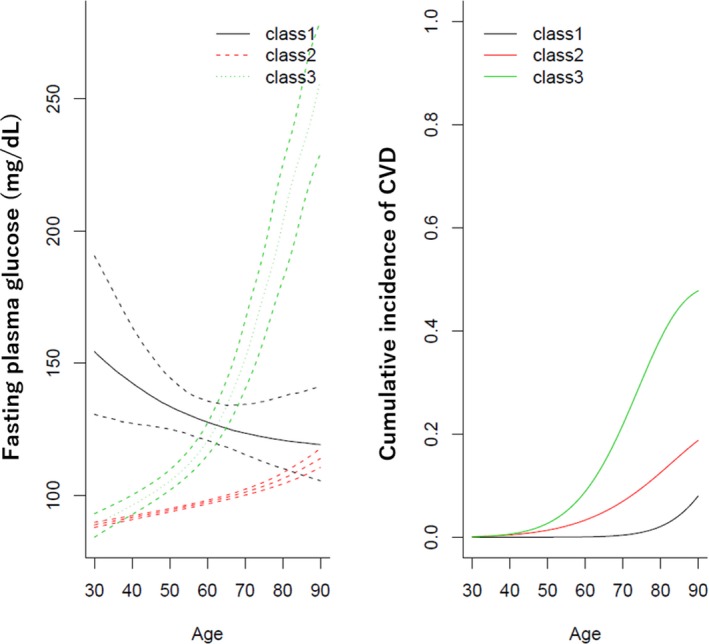
Figure 1.

Trajectories of fasting plasma glucose (mg/dL) and cumulative incidence of cardiovascular diseases in men. The best‐fitted model of the joint latent mixed model shows 3 subgroups based on trajectories of fasting plasma glucose and cumulative incidence of cardiovascular diseases. The solid line represents the average fasting plasma glucose in each of the 3 classes for the mean of baseline age, body mass index, systolic blood pressure, non‐high‐density‐lipoprotein cholesterol in people with smoking (current or past) and alcohol drinking (current or past), and people without medication uses for diabetes mellitus, hypertension, and dyslipidemia at baseline. Dotted lines represent 95% CIs obtained by the Monte Carlo method. The right figure shows the average cumulative incidence of cardiovascular diseases in each of the 3 classes for the mean of baseline age, body mass index, systolic blood pressure, non‐high‐density‐lipoprotein cholesterol in people with smoking (current or past) and alcohol drinking (current or past), and people without medication uses for diabetes mellitus and hypertension at baseline.
