
Figure 2.
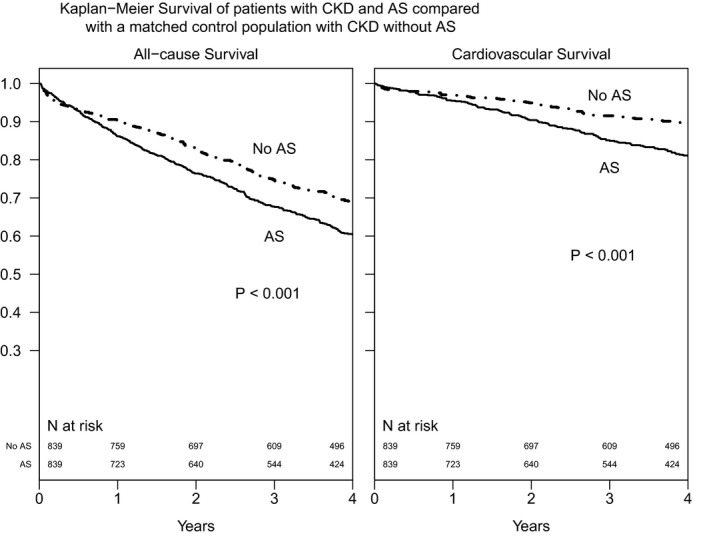
Kaplan–Meier survival curves of patients with CKD and AS compared with a matched control population of patients with CKD without AS. Cases and controls were propensity matched on age, sex, race, estimated glomerular filtration rate, ejection fraction, and year of echocardiogram. AS indicates aortic stenosis; CKD, chronic kidney disease.