
Figure 2.
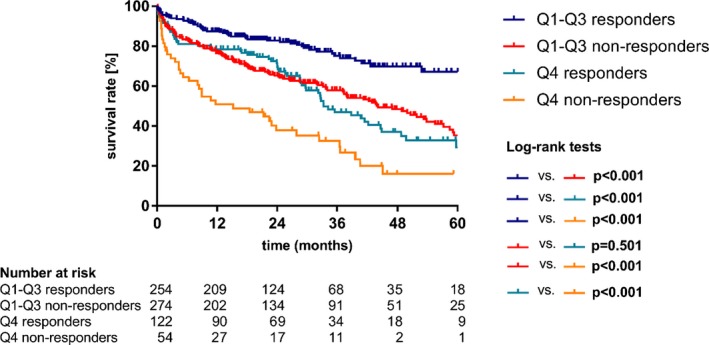
Relevance of a combination of periprocedural NT‐proBNP (N‐terminal pro–B‐type natriuretic peptide) changes and baseline NT‐proBNP levels. Kaplan–Meier survival curves for overall survival of subgroups based on responder status and baseline NT‐proBNP levels. (Q4=upper quartile). Q indicates quartile.