
Figure 8.
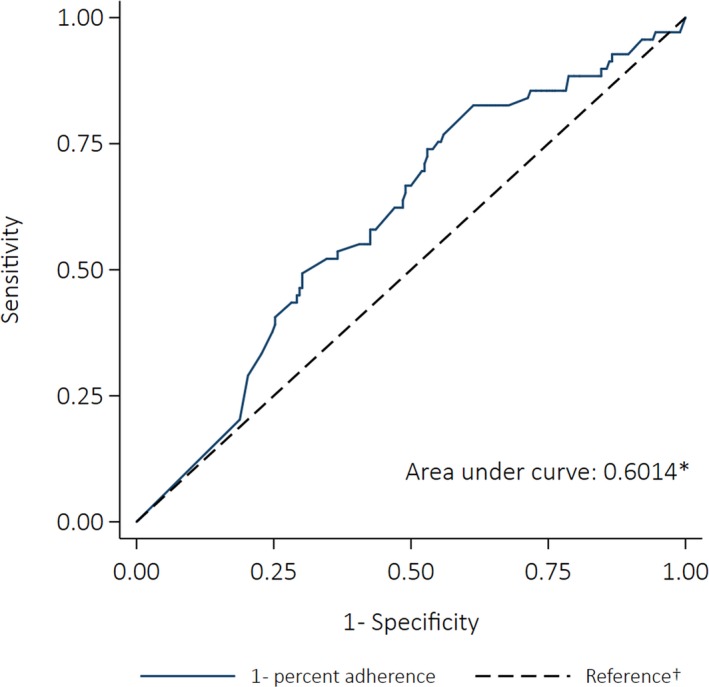
Receiver operating characteristics curve for the ability of percent adherence to predict all‐cause mortality (case–control analysis). *The area under the curve was calculated using nonparametric methods; †The reference line indicates the point at which adherence would be no better at predicting an outcome than a coin toss (the area under the reference line is 0.5).