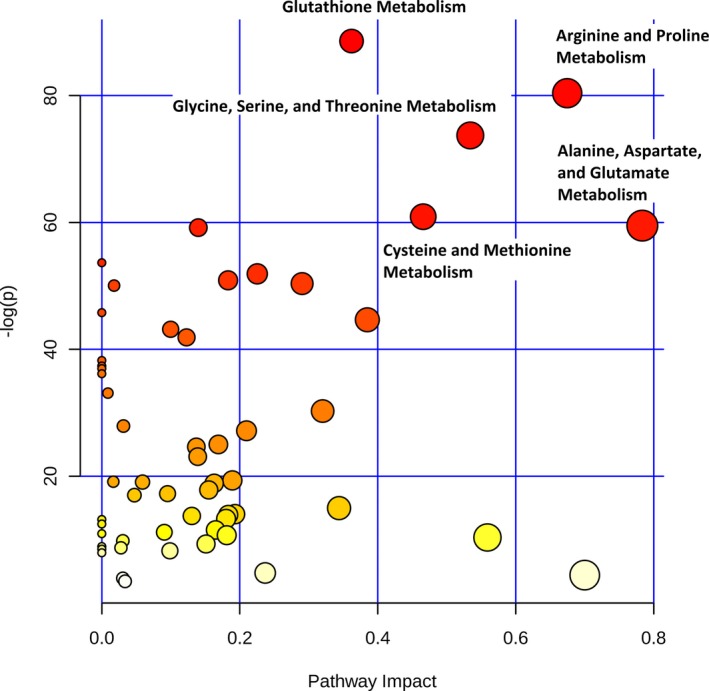
Figure 5.

Difference in metabolic pathways among preoperative, rewarming, and 24‐hour time points across the full cohort. The x axis and size of circles represent impact of differential metabolites within the pathway. The y axis and color of circles represent statistical significance of the overall metabolic changes within the pathway.
