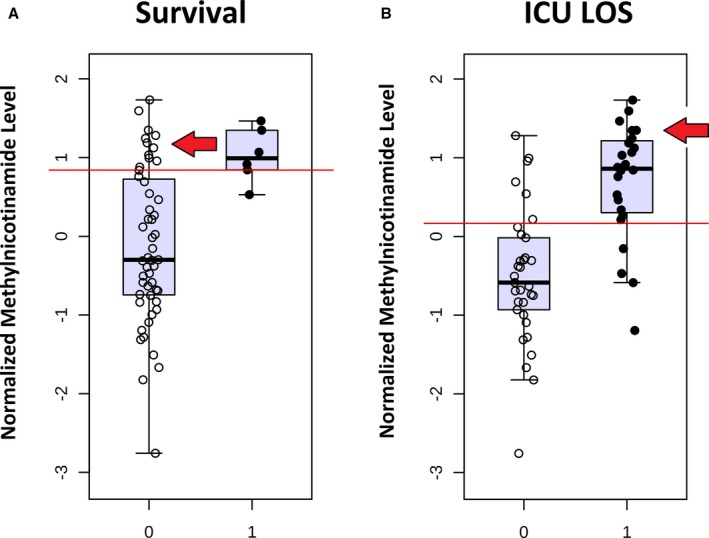
Figure 13.

Normalized methylnicotinamide levels at 24 hours in survivors (0) vs nonsurvivors (1) (A) and lower (0) vs upper (1) 50% of intensive care unit length of stay (ICU LOS) (B). Red arrows indicate subjects with high methylnicotinamide levels who survived but with extended ICU LOS.
