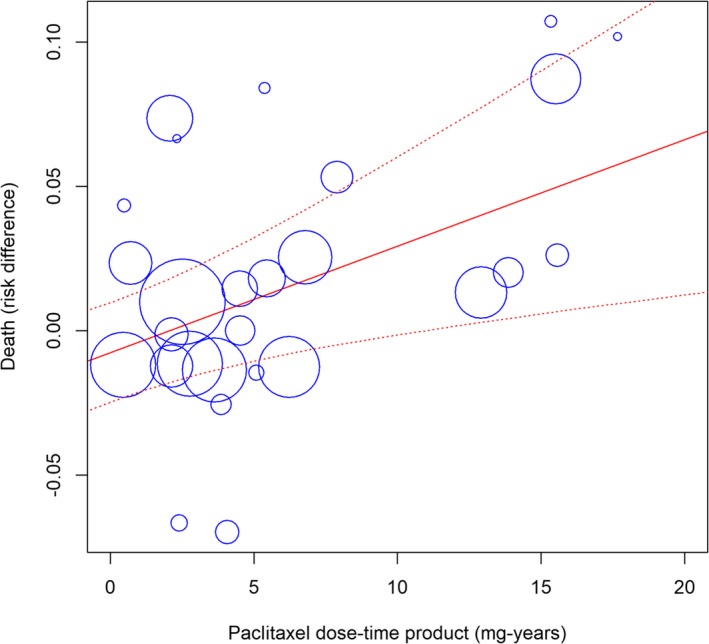
Figure 5.

Meta‐regression (mixed effects model) of all‐cause death against paclitaxel exposure (dose‐time product calculated in milligram‐years). The size of the blue symbols is inversely proportional to the variance of the estimated treatment effect for each study. Solid and dotted red lines indicate the regression line with its corresponding 95% confidence bands. Intercept is −0.8±0.9% and coefficient of the regression line is 0.4±0.1% (95% confidence interval, 0.1–0.6%; P<0.001). The equation of the regression line is Y=(−0.008)+0.004X. The “metareg” function of the “meta” library was employed in R language.
