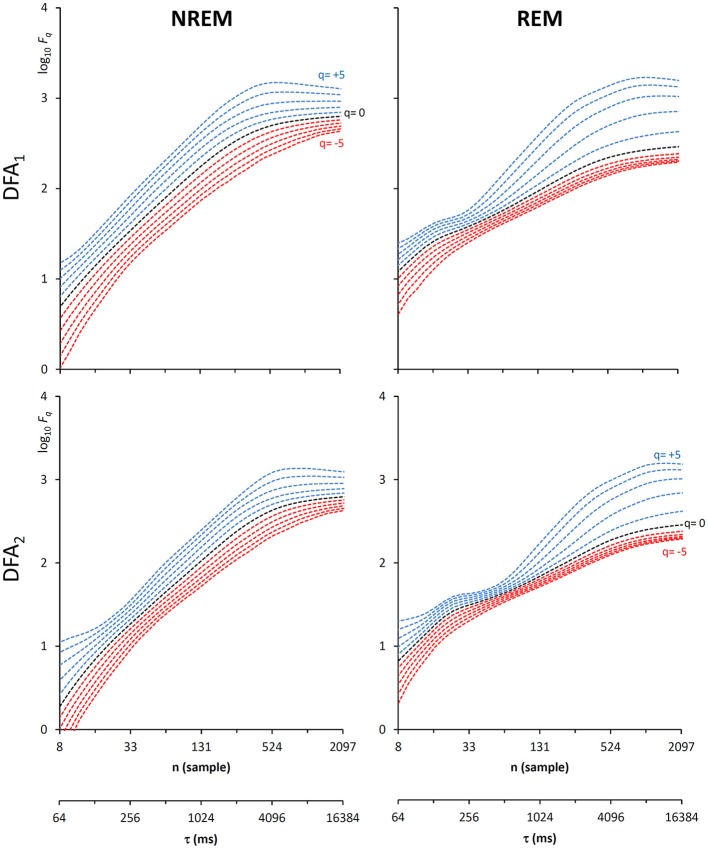
Figure 11.
Fluctuation functions of EEG during NREM and REM sleep with maximally overlapped blocks. Time series are 1600-s segments of an EEG C4 lead sampled at 128 Hz during sleep in a healthy volunteer. The first horizontal axis is the box size, n, in number of samples, the second horizontal axis is the temporal scale, τ, in milliseconds, obtained multiplying n by the sampling period. Thresholds Th1 and Th2 as in Equations (19) and EPS = 10−4.

