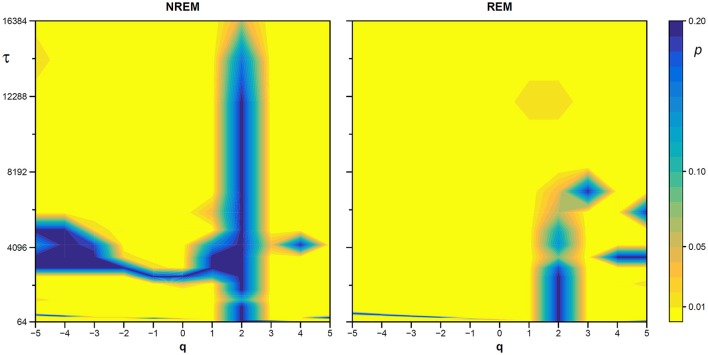
Figure 13.
Statistical significance of nonlinearity test on EEG scale coefficients. Each point represents the two-sided, type-I error probability to reject the null hypothesis comparing scale coefficients of the original series and of Fourier-phase shuffled surrogate series at each scale τ and moment-order q; differences significant at p < 0.01 are indicated in yellow. The scale, τ, in milliseconds, is the box size n multiplied by the sampling period.

