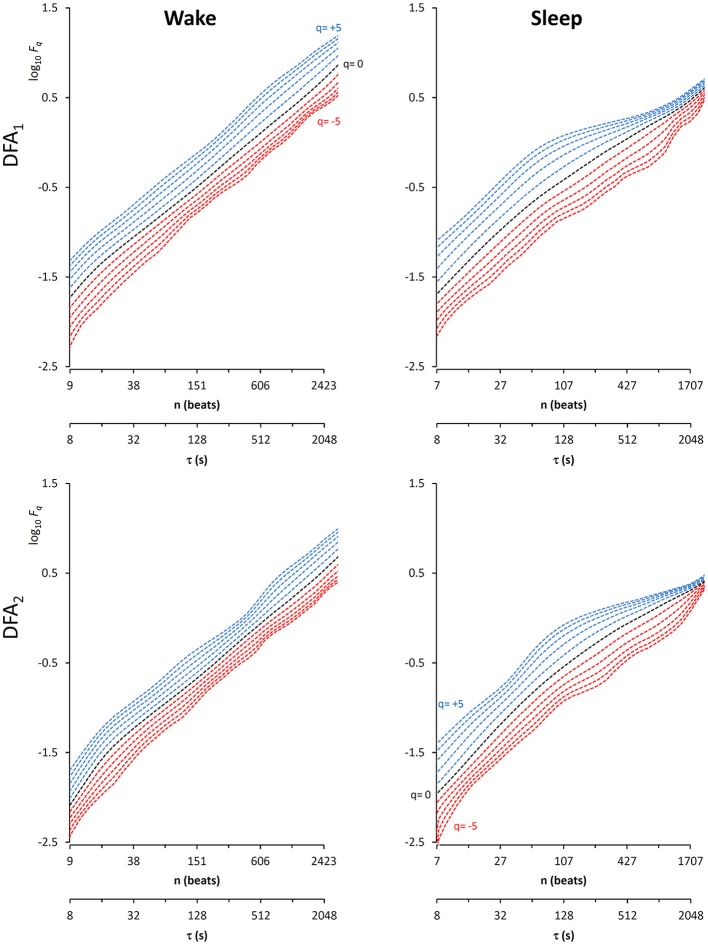
Figure 8.
Multifractal fluctuation functions of heart-rate variability during Wake and Sleep with maximally overlapped blocks. The original series are two 4-h segments of beat-by-beat R-R intervals from a 24-h ECG recording in a healthy volunteer. The first horizontal axis is the box size n, in number of beats; the second horizontal axis is the temporal scale τ, in seconds, obtained multiplying n by the mean R-R interval, which is shorter in Wake than in Sleep. Thresholds Th1 and Th2 as in Equations (19) and EPS = 0.

