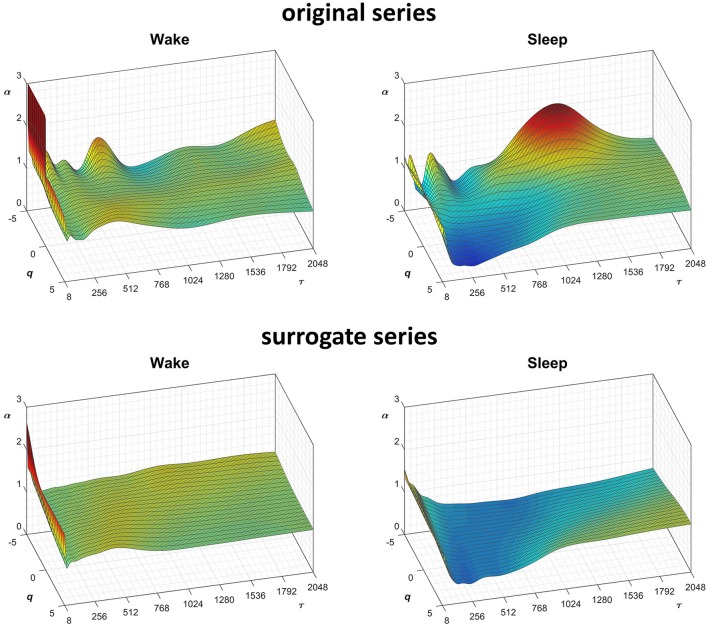
Figure 9.
Scale coefficients of heart-rate variability during Wake and Sleep, for original and surrogate series. Coefficients calculated by Equations (22), combining DFA1 and DFA2 estimates by Equations (23); for surrogate data, the figure shows the average α surface over 100 series generated shuffling the phases of the Fourier spectrum of the original series. To more easily compare Wake and Sleep conditions, which are characterized by different heart rates, the τ axis represents the temporal scale in seconds; τ is obtained multiplying the box size, n, with the mean R-R interval (see Figure 8).

