
Figure 2.
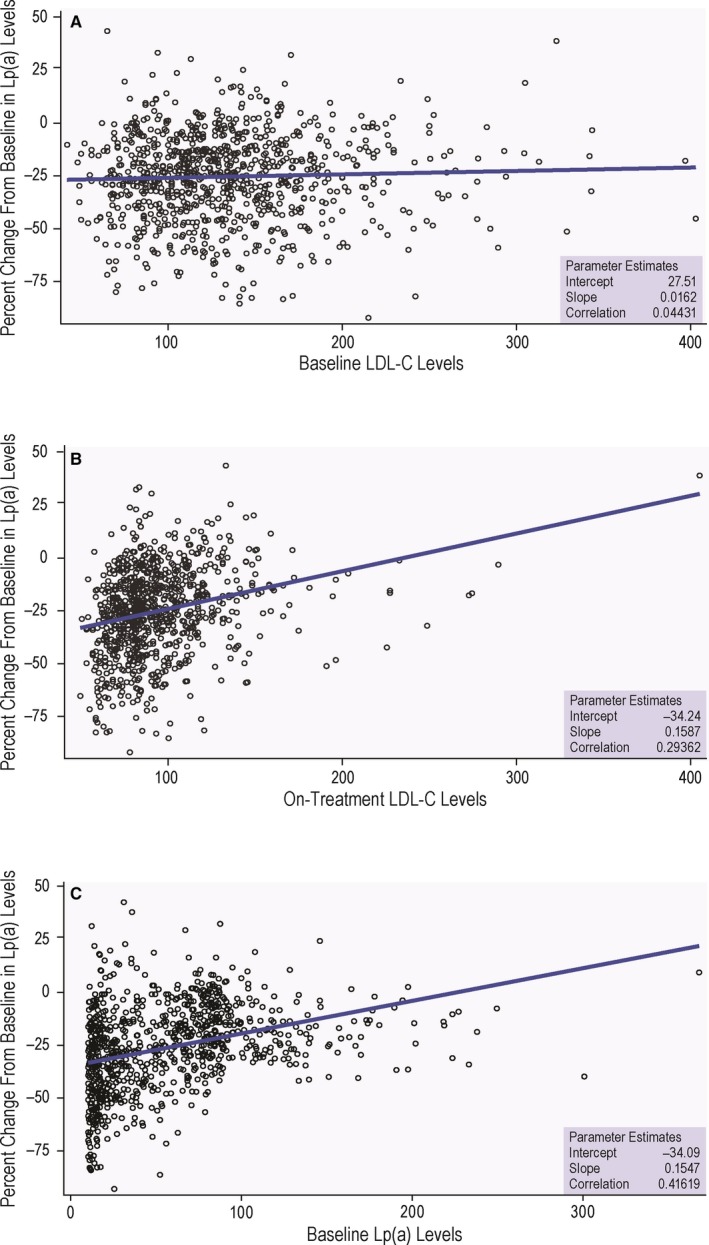
Relationship between percentage reduction in Lp(a) and selected variables. Relationship between percentage reduction in Lp(a) and baseline LDL‐C (A), on‐treatment LDL‐C (B), and baseline Lp(a) concentration (C) for the overall cohort at 12 weeks of evolocumab therapy. LDL‐C indicates low‐density lipoprotein cholesterol; Lp(a), lipoprotein(a).