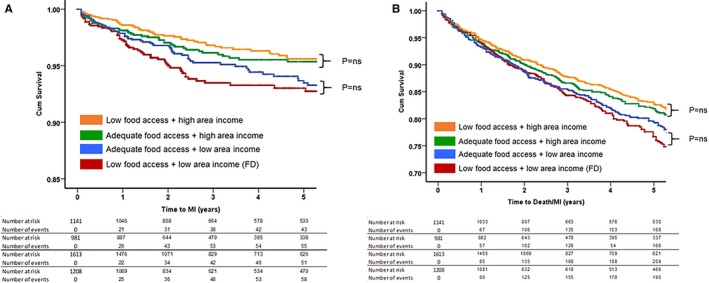
Figure 3.

Kaplan–Meier curves for association between food access and area income with (A) incident myocardial infarction (MI) and (B) incident composite event rate of all‐cause death/MI. P values were derived from log‐rank tests. A, Incident MI. B, Incident death/MI. FD indicates food desert; ns, not significant.
