Figure 1.

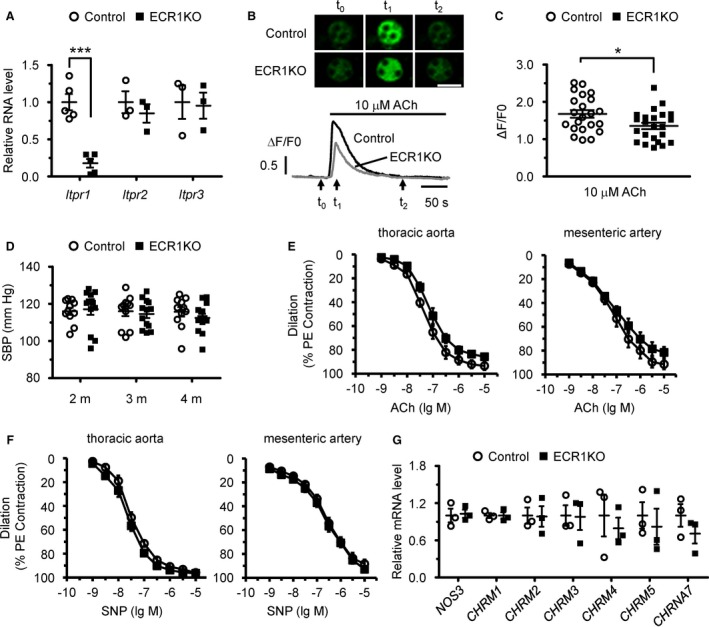
Endothelial cell–specific deletion of inositol 1,4,5‐trisphosphate receptor 1 (IP 3R1) in adult mice had no major effects on blood pressure and vasodilation. A, mRNA levels of IP 3Rs in isolated endothelial cells from control and endothelial cell–specific IP 3R1 knockout (ECR1KO) mice. n=3 to 5 (with endothelial cells from 3 mice pooled as 1 sample) per group. B, Confocal Ca2+ imaging of isolated endothelial cells using Fluo‐4‐AM. Intracellular Ca2+ mobilization was elicited by 10 μmol/L acetylcholine. Top, Sequential confocal images of endothelial cells at the time points of time 0, time 1, and time 2, as indicated by the arrows at the bottom. Bar=20 μm. Bottom, Representative traces of Ca2+ signals in control (black) and ECR1KO (gray) endothelial cells. F0, the Fluo‐4 fluorescence at rest. F/F0, normalized fluorescence. C, The amplitude of Ca2+ signals induced by 10 μmol/L acetylcholine. n=20 to 30 cells from 3 independent experiments per group. D, Systolic blood pressure (SBP) measured in control and ECR1KO mice at 2, 3, and 4 months after tamoxifen injection using the tail‐cuff system. n=11 to 12 mice per group. E, Vascular reactivity in response to endothelium‐dependent agonist acetylcholine in ECR1 aortas and mesenteric arteries showed a slight trend toward reduced vasodilation that was not statistically significant. F, Vascular reactivity in response to endothelium‐independent agonist sodium nitroprusside (SNP) in aortas and mesenteric arteries. The vessels were preconstricted by 10 μmol/L phenylephrine, and the vasorelaxing effects of acetylcholine and sodium nitroprusside (SNP) were presented as a percentage of phenylephrine‐induced contraction. n=6 mice per group. G, Quantitative real‐time polymerase chain reaction analysis of the expression of NOS3 and major acetylcholine receptors, including CHRM1,CHRM2,CHRM3,CHRM4,CHRM5, and CHRNA7, in control and ECR1KO endothelial cells. n=3 (with endothelial cells from 3 mice pooled as 1 sample) per group. Significance was determined using a 2‐tailed, unpaired, Student t test or 2‐way ANOVA analysis with Bonferroni post hoc test. Error bars represent mean±SEM. *P<0.05, ***P<0.001 vs control.
