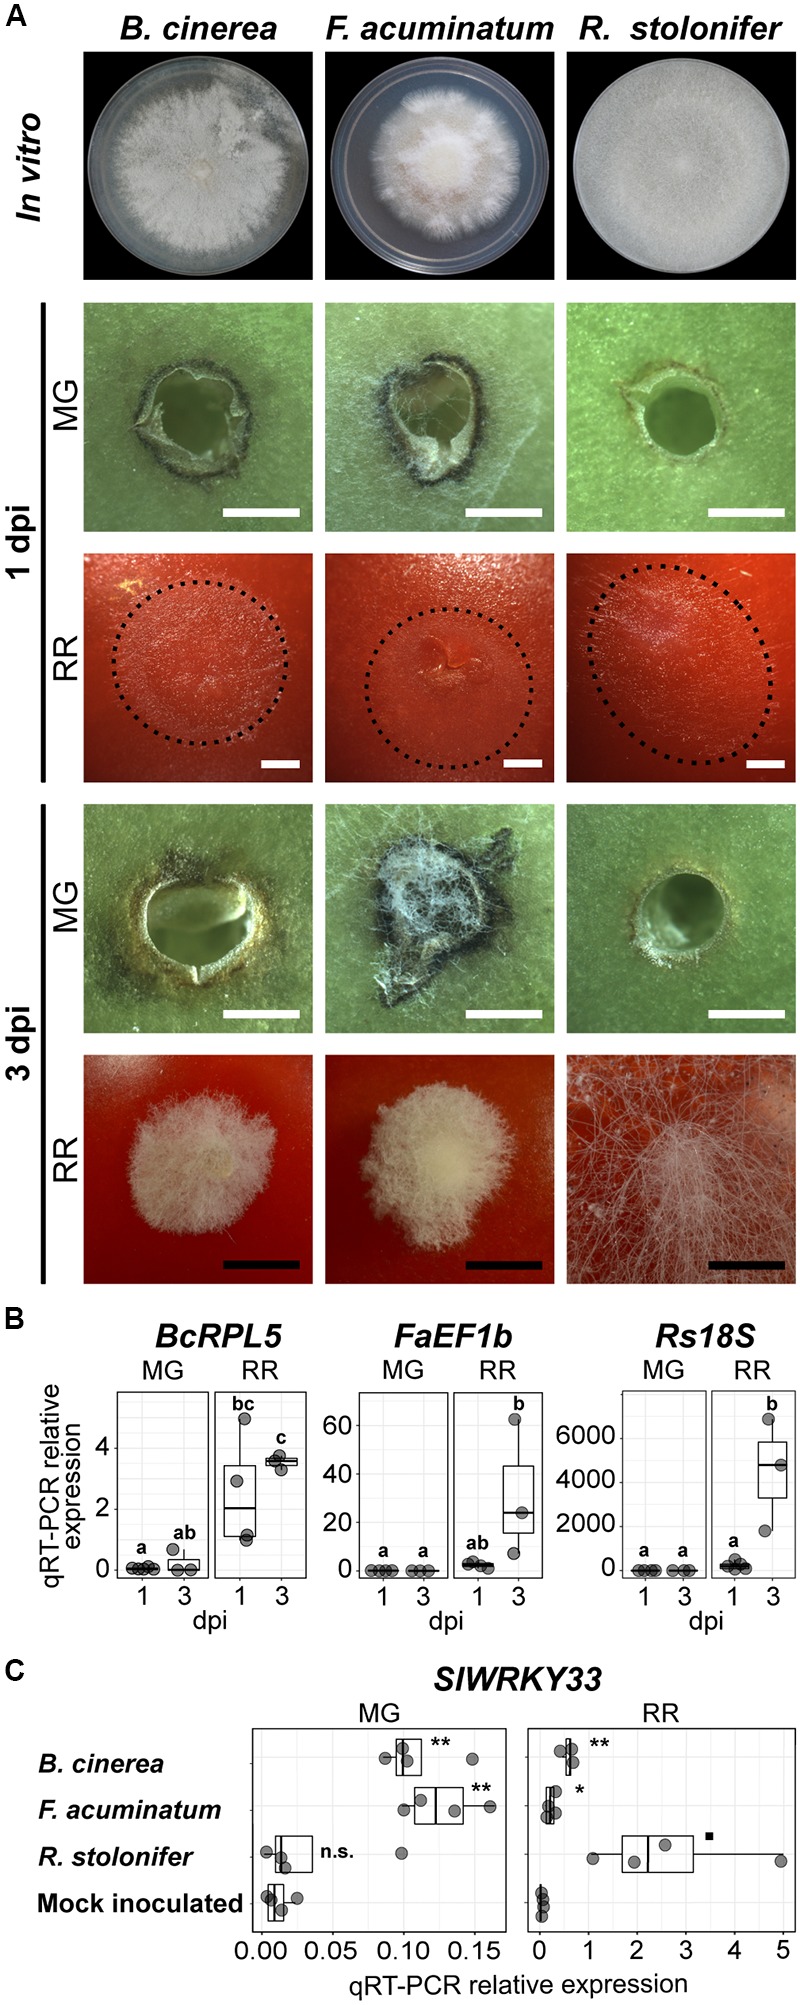
FIGURE 1.

Fungal growth and disease development in tomato fruit. (A) Growth and lesion development of the three fungi in vitro and during inoculation, respectively. Fungi were grown on PDA in 100 mm Petri dishes. In vitro morphology represents the pre-sporulation stage used for this study at 3 (Rhizopus stolonifer), 5 (Botrytis cinerea) and 7 (Fusarium acuminatum) days post-plating. Fungal growth and lesion development during fruit inoculation is shown at 1 and 3 days post-inoculation (dpi) in mature green (MG) and red ripe (RR) fruit. The extent of mycelial growth is highlighted by dotted lines for 1 dpi RR fruit. White and black bars correspond to 1 and 5 mm, respectively. (B) Fungal biomass estimated by the relative expression of the reference genes BcRPL5 (Bcin01g09620), FaEF1b (FacuDN4188c0g1i4), and Rs18S (RstoDN6002c0g2i1), normalized based on the tomato reference gene expression (SlUBQ, Solyc12g04474). Significant differences (P < 0.05) between the biomass of the four treatments are denoted by letters. (C) Relative expression of the disease responsive tomato gene SlWRKY33 (Solyc09g014990) in samples inoculated with the three fungi and in the mock-inoculated control. Symbols indicate statistical significance (n.s., not significant; ◼P < 0.1; ∗P < 0.05; ∗∗P < 0.01) when comparing inoculations with each pathogen and the control.
