
FIGURE 1.
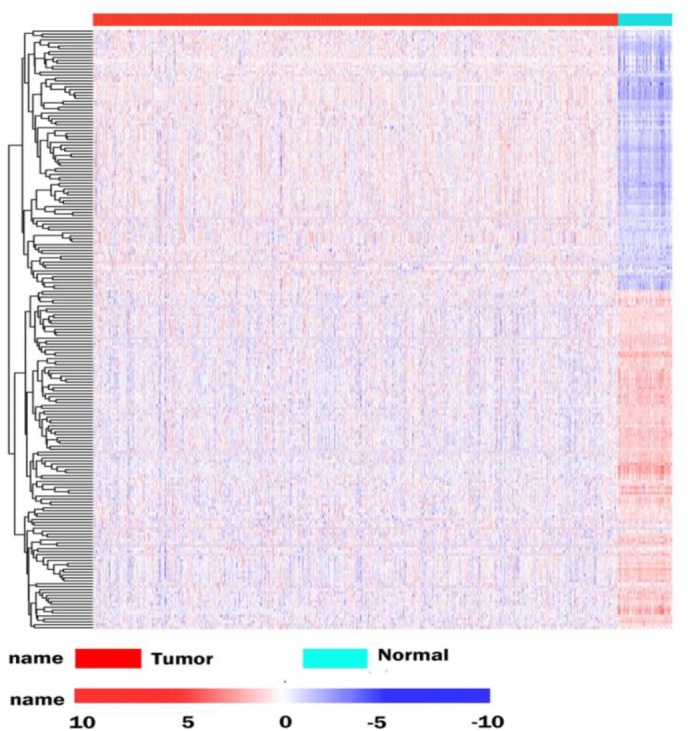
Differentially expressed RBPs in BRCA cancer. Unsupervised clustering analysis was performed using the pheatmap function, using complete and Euclidean as metrics in R, based on log2-transformed FPKM values. The columns are samples and the rows are RBPs. The blue represents down-regulation, while red represents up-regulation.