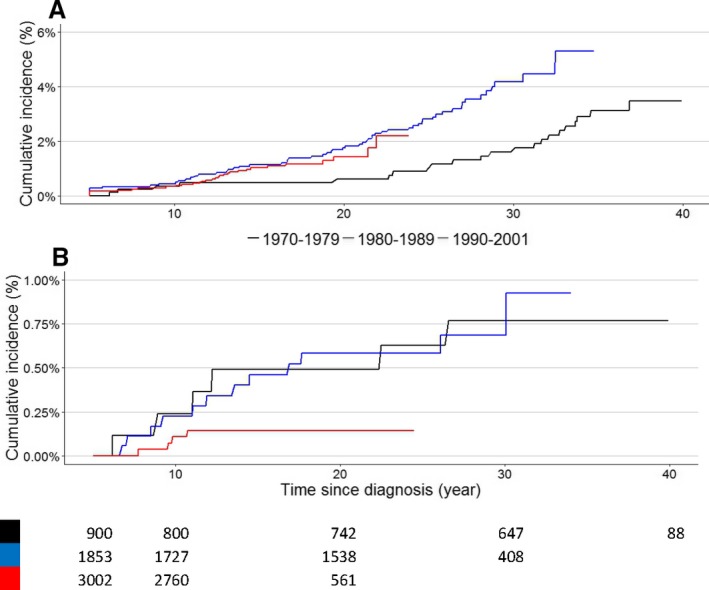
Figure 3.

A, Cumulative incidence of heart failure (grades 3, 4, and 5) per treatment period, with time since childhood cancer diagnosis. P‐value for Gray test: 1970–1979 vs 1980–1989, P=0.011; 1970–1979 vs 1990–2001, P=0.03; 1980–1989 vs 1990–2001, P=0.81 B, Cumulative incidence of heart failure grade 5, fatal events, per treatment period with time since childhood cancer diagnosis. P‐value for Gray test: 1970–1979 vs 1980–1989, P=0.99; 1970–1979 vs 1990–2001, P=0.04; 1980–1989 vs 1990–2001, P=0.02. All childhood cancer survivors diagnosed between 1970 and 2001 were included in this figure.
