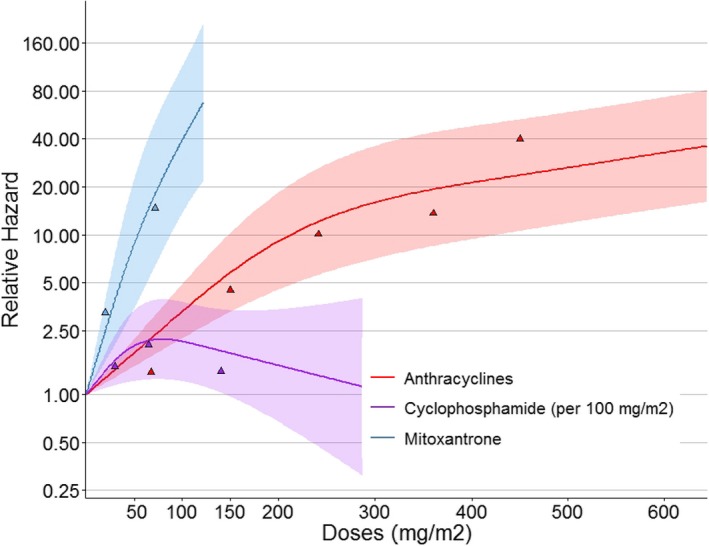
Figure 4.

Dose‐response curves of the development of heart failure with anthracyclines, mitoxantrone, and cyclophosphamide. The colored triangles are the hazard ratios (HRs) from the model presented on a logarithmic scale to show the actual HRs. The model is also corrected for sex, age at diagnosis, year of childhood cancer diagnosis, and radiotherapy where the heart was in the field yes/no. Shaded areas indicate 95% CI.
