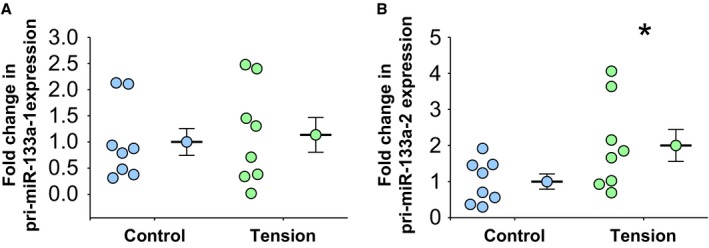
Figure 3.

Mechanical tension and transcription of primary miR‐133a‐1 and primary miR‐133a‐2. Total RNA was isolated from each individual cell line, and primary miR‐133a levels were determined by real‐time polymerase chain reaction. A, Primary miR‐133a‐1 expression levels in aortic fibroblasts exposed to 12% biaxial cyclic stretch (Tension, n=8) or held static (Control, n=8) for 3 hours. B, Primary miR‐133a‐2 expression levels in aortic fibroblasts exposed to 12% biaxial cyclic stretch (Tension, n=8) or held static (Control, n=8) for 3 hours. A and B, Data are represented in dot plots with the mean and SEM shown next to each group. Comparisons were made using a 2‐sample t test (unpaired, 2 tailed). *P<0.05 vs control.
