Figure 7.

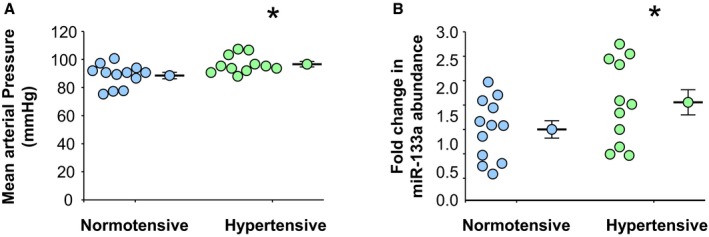
Mean arterial blood pressures and plasma levels of miR‐133a in clinical specimens. A, Patient mean arterial blood pressures assessed at time of plasma collection in normotensive (n=12) and hypertensive (n=11) patients. B, Plasma miR‐133a abundance in normotensive (n=12) and hypertensive (n=11) patients. A and B, Data are represented in dot plots with the mean and SEM shown next to each group. Comparisons were made using a 2‐sample t test (unpaired, 2 tailed). *P<0.05 vs control.
