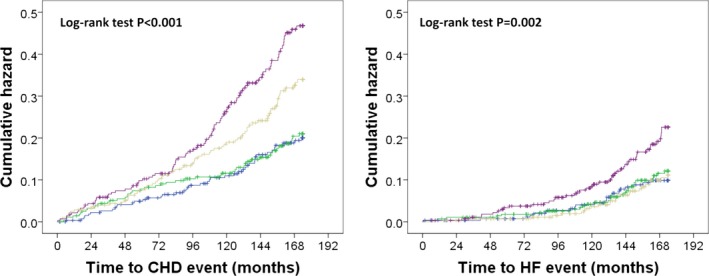
Figure 2.

Kaplan–Meier hazard plots for CHD (n=256) and HF hospitalizations and deaths (n=118) by quartiles of NGAL, blue line quartile 1 (<61.5 ng/mL), green line quartile 2 (61.5–75.8 ng/mL), beige line quartile 3 (75.9–94.8 ng/mL), and purple line quartile 4 (≥94.9 ng/mL). CHD indicates coronary heart disease; HF, heart failure; NGAL, neutrophil gelatinase‐associated lipocalin.
