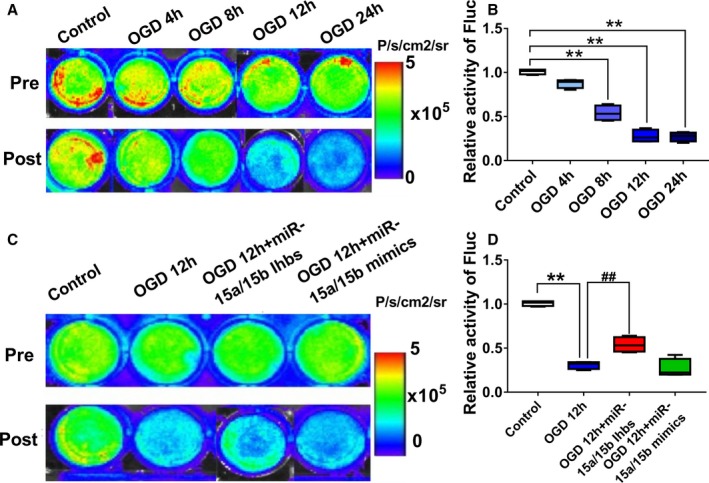
Figure 2.

In vitro visualization and region of interest (ROI) analysis of firefly luciferase gene (Fluc) activities to monitor the mesenchymal stem cells under oxygen and glucose deprivation (OGD) condition. A and B, Quantitative signals from imaging in vitro were obtained by ROI analysis and were shown next to each well picture. The bioluminescence imaging (BLI) results showed a drastic decrease in Fluc activities with prolongation of OGD treatment time, especially in the OGD 12 hour and OGD 24 hour groups. Data are expressed as median (quartile 1–quartile 3), n=6 independent experiments for each condition. **P<0.01 vs Control. C and D, Quantitative signals from Control, OGD 12 hours, OGD 12 hour+miR‐15a/15b inhibitors, and OGD 12 hour+miR‐15a/15b mimics groups imaging in vitro were obtained by ROI analysis and were shown next to each well picture. The BLI results showed a drastic decrease in Fluc activities in the OGD group after 12 hours OGD stimulation relative to Control, but the miR‐15a/15b inhibitors treatment could partially reverse the decrease induced by OGD. Data are expressed as median (quartile 1–quartile 3), n=6 independent experiments for each condition. **P<0.01 vs Control; ## P<0.01 vs OGD 12 hour group.
