Figure 5.

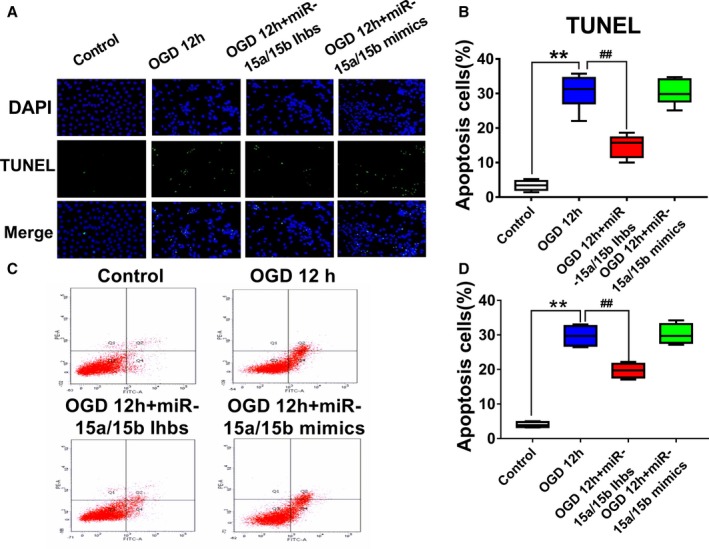
A, Apoptotic mesenchymal stem cells (MSCs) were determined by transferase‐mediated deoxyuridine triphosphate–digoxigenin nick‐end labeling (TUNEL) staining and visualized at ×200 magnification. Green color is TUNEL staining representing apoptotic cell; blue color is the cell nucleus stained by 4′,6‐diamidino‐2‐phenylindole. B, The number of apoptotic cells was significantly increased in cells treated with oxygen and glucose deprivation (OGD) than in control group, whereas the downregulation of miR‐15a/15b could attenuate the effect of OGD. Data are expressed as median (quartile 1–quartile 3), n=10. C and D, The apoptotic rate of luc‐MSCs was detected by fluorescein isothiocyanate–annexin V labeling and flow cytometric analysis. Luc‐MSCs were pretreated with miR‐15a/15b inhibitors or with miR‐15a/15b mimics under OGD 12 hours. miR‐15a/15b inhibitors obviously inhibited the apoptotic rate of MSCs under OGD condition, whereas miR‐15a/15b mimics could attenuate the proapoptotic role of OGD. The data are presented as the median (quartile 1–quartile 3) for 4 independent experiments. **P<0.01 vs Control; ## P<0.01 vs OGD group.
