Figure 7.

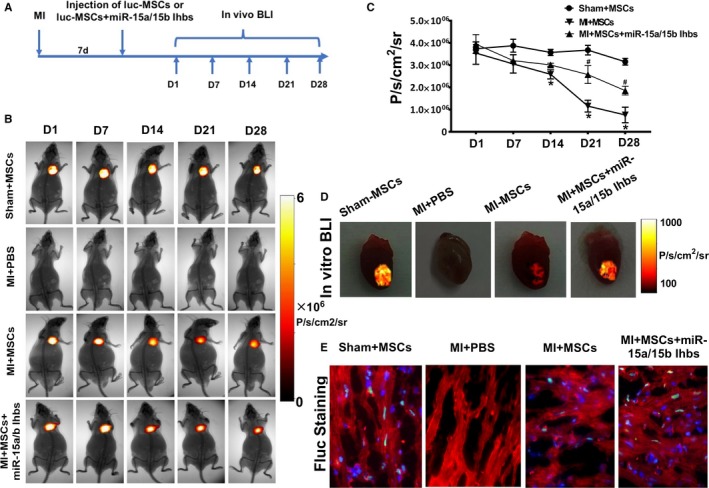
In vivo visualization and region of interest (ROI) analysis of firefly luciferase gene (Fluc) activities to monitor the mesenchymal stem cells (MSCs) in the animal model. A, Schematic diagram of experimental process in vivo. B, Bioluminescence imaging (BLI) of luc‐MSCs in PBS, luc‐MSC, and luc‐MSC+miR‐15a/15b inhibitors groups in myocardial infarction (MI) animal models. Color scale bar values are in photons per square centimeter per second per steradian (P/s/cm2/sr). C, Quantitative signals from imaging in vivo were obtained by ROI analysis and were shown next to the mouse picture. The BLI results showed a drastic decrease in Fluc activities of luc‐MSCs in the MI group after 14 days in vivo, and the quantitative imaging signals from luc‐MSC group nearly reduced by half. However, the reduction of imaging signals could be reversed by coapplication of miR‐15a/15b inhibitors. Data are expressed as median (quartile 1–quartile 3), n=5 independent experiments for each condition. D, BLI of luc‐MSCs in Sham+MSC, MI+PBS, MI+MSC, and luc‐MSC+miR‐15a/15b inhibitors hearts in vitro. Color scale bar values are in P/s/cm2/sr. E, Fluorescence microscopy of Fluc+ MSCs in hearts from luc‐MSC and luc‐MSC+miR‐15a/15b inhibitors groups, but no Fluc+ staining in heart tissues from MI+PBS group. *P<0.05 vs luc‐MSC group. # P<0.05 vs MI+MSCs group.
