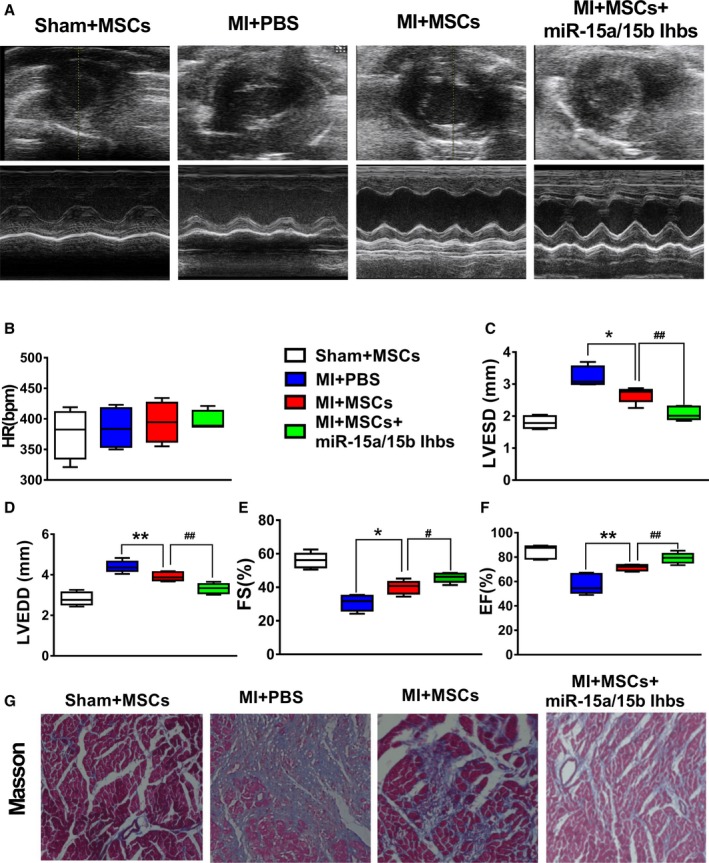
Figure 8.

Effects of cell transplantation on heart function. A, Representative M‐mode echocardiographs from PBS, luc‐mesenchymal stem cells (MSCs), and luc‐MSCs+miR‐15a/b inhibitors. B through F, Heart rate (beats per minute [bpm]), left ventricular end‐systolic diameter (LVESD), left ventricular end‐diastolic diameter (LVEDD), fractional shortening (FS), and ejection fraction (EF) from PBS, luc‐MSC, and luc‐MSC+miR‐15a/b inhibitors groups. Data are expressed as median (quartile 1–quartile 3), n=5 independent experiments for each condition. G, Masson trichrome staining from mice with myocardial infarction (MI) treated with PBS, luc‐MSCs, and luc‐MSCs+miR‐15a/b inhibitors. The collagen was stained blue. *P<0.05, **P<0.01 vs PBS group; # P<0.05 vs luc‐MSC group; ## P<0.01 vs luc‐MSC group.
