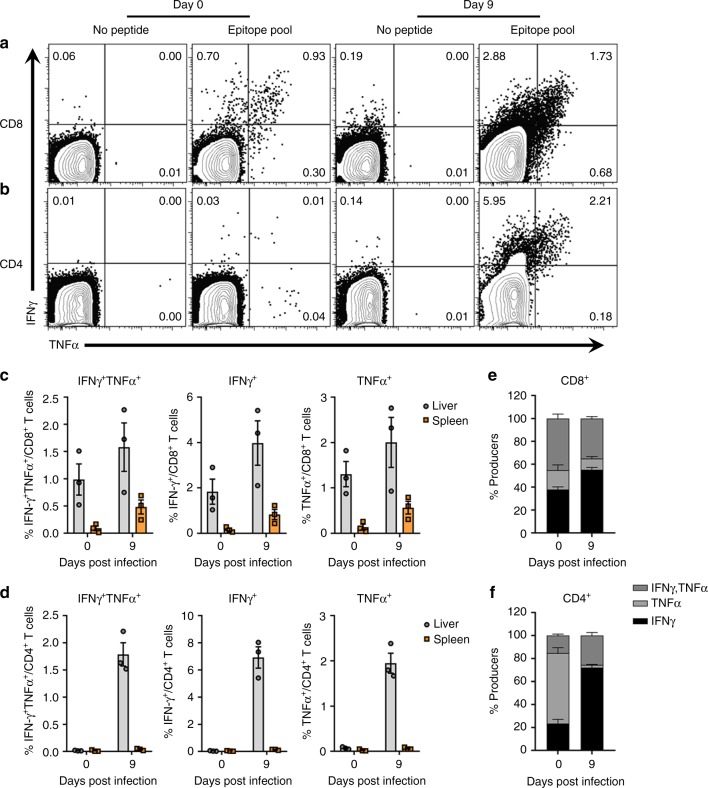
Fig. 4.
RHV-specific T cell responses during vaccine-mediated resolution. Lewis rats were immunized intramuscularly with 5 ×10⁸ ifu Ad-NSmut. After 3 weeks, rats were challenged intravenously with 106 genomes RHV. At days 0 and 9 post infection, virus-specific T cell responses were quantified by flow cytometric analysis. a, b Representative flow plots of intrahepatic IFNγ and TNFα production in CD8+ a and CD4+ b T cells. Mononuclear cells were stimulated for 5-h with media alone or a pool of MHC class I and II epitopes (5 µg/mL). Numbers indicate frequency of cytokine positive cells within T cell gate. c, d Calculated frequencies of total and dual positive cytokine producers in CD8+ c and CD4+ d T cell compartments. Responses in liver (gray circles) and spleen (orange squares) are shown for comparison. Data from n = 3 rats per group are shown (mean±SEM). e, f Relative frequency of intrahepatic RHV-specific CD8+ e or CD4+ f T cells producing IFNγ or TNFα at 0 and 9 days post infection. Data from n = 3 rats per group are shown (mean±SEM)

