
Figure 3.
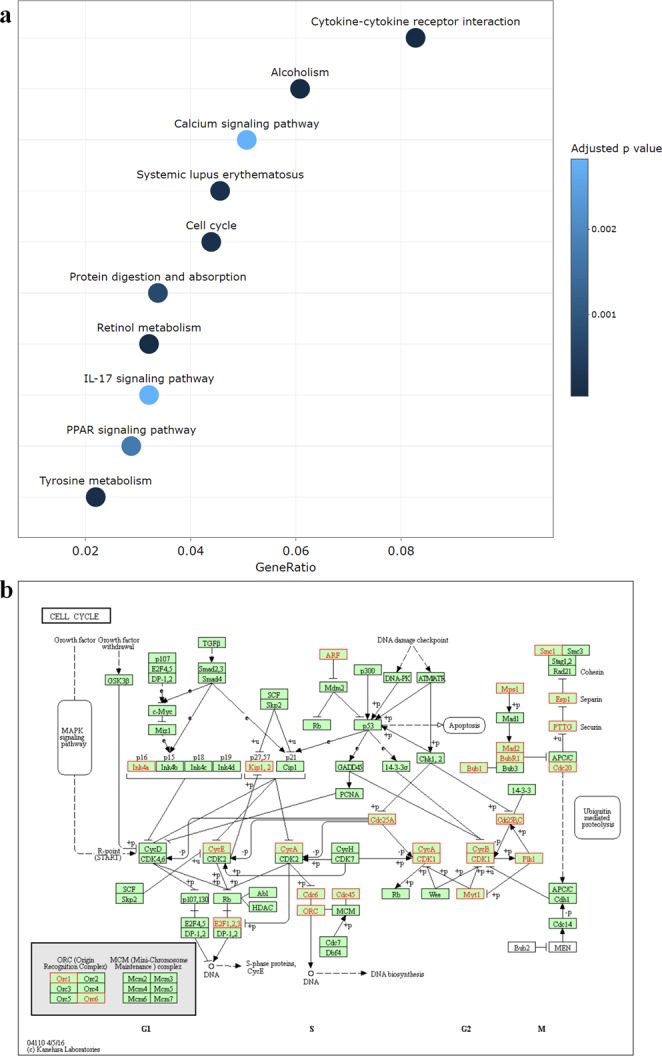
KEGG pathway enrichment results for differentially expressed genes (DEGs) in breast invasive carcinoma. (a) Enriched KEGG pathways are listed in a distribution plot in which the x-axis shows the ratio of genes included in DEGs for each pathway and the colors represent the adjusted enriched p-values. (b) TACCO provides links to KEGG pathway plots21. Here the enriched pathway cell cycle is shown where all the genes included in DEG list are written in red and highlighted in the red boxes.