Fig. 2.
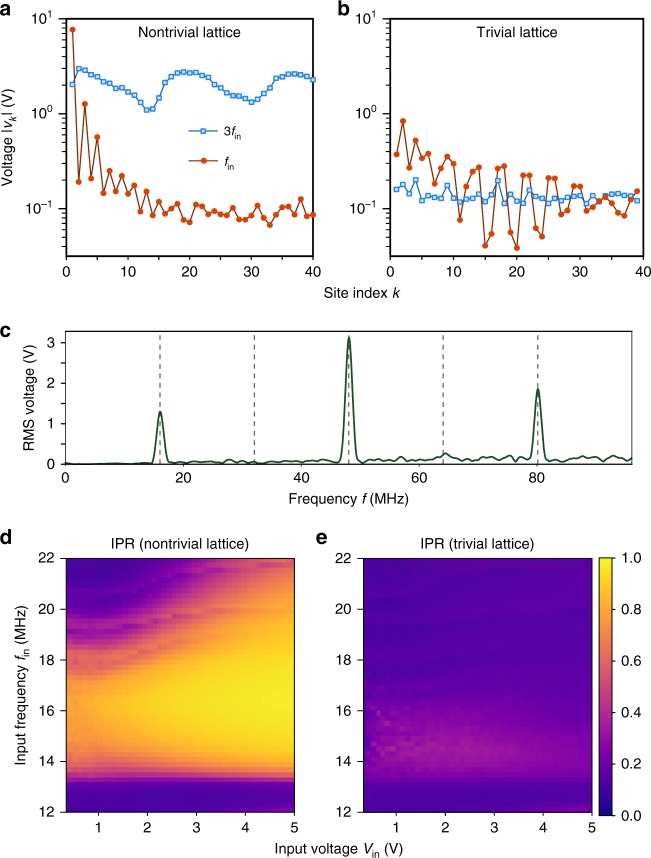
Experimental observation of harmonic generation in the nonlinear circuit. a, b Magnitude of the first- and third-harmonic voltage signals measured at different lattice sites, for a the nontrivial lattice, which has an SSH-like edge state in the linear limit, and b the trivial lattice, which has no edge state in the linear limit. The sinusoidal input signal, applied at the lattice edge (site 0), has frequency fin = 16 MHz and amplitude Vin = 2.5 V. c Measured spectrum at site 3 for the nontrivial lattice corresponding to a. d, e Plot of the inverse participation ratio (IPR) versus input frequency fin and input voltage amplitude Vin, calculated from experimental measurements of the first-harmonic signal in the d nontrivial lattice and e trivial lattice. Here, fin is measured in steps of 0.2 MHz, and Vin in steps of 0.1 V

